
Quotex Market Pakistan: Features, Assets & Trading Guide
Master Support and Resistance Trading on Quotex
Support and resistance levels are the backbone of price action trading, and on Quotex they give Pakistani traders a clear framework for reading charts without drowning in indicators. This guide walks through how to mark zones, confirm entries, and manage risk around the levels that matter most. If you want a practical system you can apply on your next session, start with a live account at quotex and follow along.
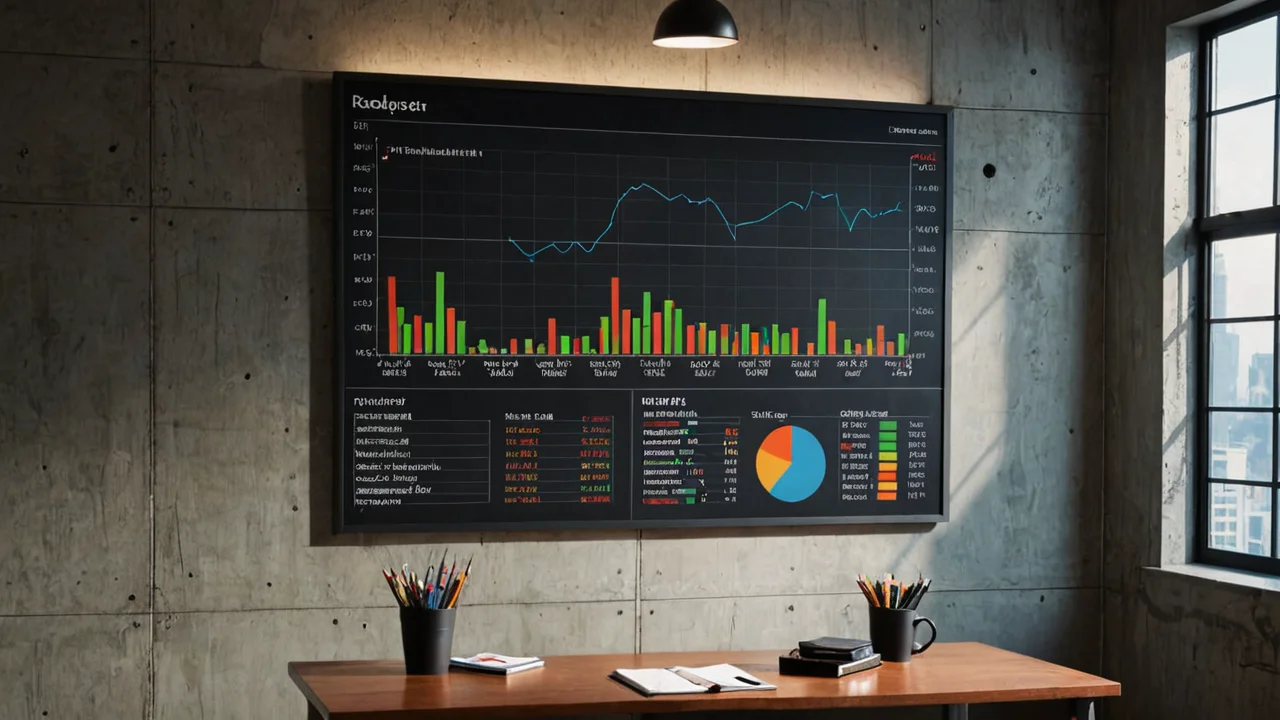

What Support and Resistance Actually Mean On Quotex
Support is a price area where buyers have repeatedly stepped in and stopped a decline. Resistance is the mirror image: a zone where sellers have capped rallies. On Quotex charts these zones appear as horizontal bands, not thin lines, because markets rarely reverse at an exact number.
Traders in Pakistan often treat these levels as fixed walls. They are not. A level is a memory of past order flow, and its strength depends on how many times price reacted there and how much volume accompanied the reaction.
The most reliable zones are the ones that produced sharp, fast rejections, not slow drifts. A level that held three times with long wicks is far more meaningful than one touched once in a quiet session.
- Mark zones on higher timeframes first, then refine on lower ones
- Treat the whole band as the level, not a single price
- Note whether the reaction was impulsive or sluggish
Key Takeaway: Support and resistance are zones built from repeated reactions, and their reliability grows with the number of clean touches.
Account conditions at a glance
| Minimum deposit | $10 |
|---|---|
| Minimum trade | $1 |
| Maximum payout | up to 98% |
Conditions declared by the broker; checked against public sources · 2026-10-12 · source
How To Identify Support Resistance Levels On Quotex
Start on the 1-hour or 4-hour chart and scan left for swing highs and swing lows. A swing high is a candle whose high is higher than the candles on both sides. Cluster nearby swing points into a single zone.
Once the higher-timeframe zones are drawn, drop to the 15-minute or 5-minute chart to see how price behaves inside them. This two-step process keeps you from over-marking every minor wiggle.
Fewer, cleaner levels beat a chart covered in lines. If you cannot explain why a zone matters in one sentence, delete it.
- Use the 4H chart to find major zones
- Use the 15M chart to confirm intraday reactions
- Delete any level that has not been tested in the last 100 candles
For traders who want to combine these zones with candle signals, the quotex-candlestick-patterns-beginners-guide breaks down the rejection patterns that matter most at key levels.
Key Takeaway: Build your level map from the top down, and keep only the zones that have proven themselves recently.
Work out the payout
Profit $0
Returned in total $0
Lost if the trade fails $0
The calculator uses the payout the broker declares; the actual percentage depends on the asset and the moment of entry.
Reading Price Action At Key Levels
A level by itself is not a signal. What price does when it reaches the zone is the signal. Watch for rejection wicks, engulfing candles, and momentum shifts right at the band.
When price approaches resistance, ask whether the candles are getting smaller or larger. Shrinking candles suggest hesitation and a possible reversal. Expanding candles suggest the level is about to break.
The candle that closes at the level tells you more than the candle that touches it. A strong close through a zone flips its role: old resistance becomes new support.
- Rejection wick plus lower high = potential short
- Bullish engulfing at support = potential long
- Weak close inside a zone = wait for the next candle
Key Takeaway: Let the reaction candle confirm the level before you commit to a trade direction.
What these terms mean
- Risk per trade
- The share of the balance committed to a single contract.
- Technical indicator
- A calculation drawn over price history; it describes what has happened, not what will.
- Position sizing
- The rule that converts a balance into the amount committed to one contract.
Building A Price Action Strategy For Quotex Pakistan
A workable strategy has three parts: where you enter, where you exit if wrong, and where you take profit. Support and resistance define all three.
Enter on the retest of a broken level, not on the breakout candle itself. This reduces the chance of buying the top of a spike. Place your stop just beyond the zone, and target the next major level in the direction of your trade.
Risk should never exceed a small, fixed percentage of your account on any single trade. Position size is calculated from the distance tradeween entry and stop, not from how confident you feel.
What these terms mean
- Trading journal
- A record of entries, exits and reasons, kept to review decisions rather than outcomes.
- Underlying asset
- The instrument a contract is written on — a currency pair, an index, a commodity or a crypto asset.
- Spread
- The gap between buying and selling price quoted at the same moment.
- Entry
- retest of the flipped level
- Stop
- a few pips beyond the zone
- Target
- the next higher-timeframe level
Traders who prefer shorter sessions can adapt this to a faster rhythm using the quotex-5-minute-trading-strategy-beginners framework, which applies the same zone logic on lower timeframes.
Key Takeaway: Support and resistance give you entry, stop, and target in one clean structure, which makes risk sizing straightforward.
Combining Zones With Trend And Momentum
Levels work best when they align with the broader trend. In an uptrend, support zones are more likely to hold and resistance zones are more likely to break. In a downtrend, the opposite is true.
Check the direction of the 4-hour chart before you act on a 5-minute setup. If the higher timeframe is rising, favour long entries at support and treat resistance as a target rather than a reversal point.
Trading against the higher-timeframe trend at a level is a low-probability trade. You can still take it, but the stop needs to be tighter and the target smaller.
What these terms mean
- Quick trading
- A contract with a fixed expiry chosen before entry; the result is settled at that moment, not when the trader closes it.
- Expiry
- The moment a contract is settled. It is fixed when the trade is opened and cannot be moved afterwards.
- Demo account
- A funded practice account with virtual money. Prices are live, the balance is not real.
- Uptrend
- buy support, sell into resistance
- Downtrend
- sell resistance, buy into support
- Range
- fade both edges of the range
Key Takeaway: The trend decides which side of the level you should be trading from.
Common Mistakes With Support Resistance On Quotex
The most frequent error is drawing too many levels. A chart with twenty lines is a chart with no plan. Another is treating a level as permanent, even after price has sliced through it several times.
Traders also enter too early, before the reaction candle closes, and get stopped out by a wick. Patience at the level is what separates consistent results from random outcomes.
A level that has been broken and retested is a new opportunity, not a failed one. Update your map after every significant move.
- Over-marking minor swings
- Ignoring the higher-timeframe trend
- Entering before confirmation
- Moving stops away from the zone
Key Takeaway: Clean charts, confirmed entries, and honest stops solve most of the problems traders face at support and resistance.
What these terms mean
- Asset list
- The instruments a platform quotes; it differs by region and by time of day.
- Order ticket
- The panel where amount, direction and expiry are set before a contract is opened.
- Trading session
- The hours an asset is quoted; outside them contracts on it cannot be opened.
Risk Management Around Key Levels
Even a perfect level read fails sometimes. That is why risk management matters more than prediction. Decide your maximum loss per trade before you open the platform, and never adjust it mid-trade.
On Quotex, fixed-time trades mean your risk is defined the moment you enter. Size each position so that a losing streak of several trades does not damage your account beyond recovery.
Survival is the strategy. Profits are the byproduct. Traders who last are the ones who protect capital first.
- Cap risk per trade at a small fixed percentage
- Avoid stacking multiple trades on the same level
- Review your level accuracy weekly
Key Takeaway: Consistent risk control turns a decent level-reading skill into a durable trading approach.
What these terms mean
- Market order
- An instruction to open a position at the price available now, not at a chosen level.
- Slippage
- The gap between the price requested and the price received when the market moves during execution.
Practising On Quotex Before Going Live
Use the demo environment to test your level-marking routine without financial pressure. Mark zones on several pairs, wait for reactions, and log whether your read was correct. After a few dozen observations, patterns in your own mistakes will appear.
Weekend sessions behave differently from weekday ones, and Pakistani traders often have more free time then. The quotex-otc-weekend-trading-strategy-pakistan guide covers how levels behave when markets are quieter.
Practice is only useful if you review it. Keep a simple journal of every zone you marked and what happened next.
- Test on demo for at least two weeks
- Log every level and its outcome
- Move to live only when your read is consistent
Key Takeaway: Demo practice with a written log builds the pattern recognition that live trading demands.
Terms used in this section
- Native app
- An application installed from a store and built for the operating system it runs on.
- Web terminal
- The same platform used in a browser, without installation.
- Push notification
- A message the app shows outside the browser, used for price alerts and contract results.
Frequently Asked Questions
-
What timeframe is best for support and resistance on Quotex?
Most traders start with the 4-hour chart to find major zones, then refine on the 15-minute or 5-minute chart for entries. The best timeframe depends on how long you can watch the screen.
-
How many support and resistance levels should I draw?
Keep it to three or four active zones per chart. If a level has not been tested recently or you cannot explain why it matters, remove it.
-
Can I use support and resistance for short-term Quotex trades?
Yes. The same zone logic applies on lower timeframes, though reactions are faster and require quicker decisions. Combine it with candle confirmation for tradeter accuracy.
-
Do support and resistance levels work during weekend OTC sessions?
They still form, but reactions can be less clean because liquidity is thinner. Adjust your expectations and keep targets modest during those sessions.
-
What is the biggest mistake beginners make with these levels?
Entering before the reaction candle closes. Waiting for confirmation reduces false signals, even if it means missing the very start of a move.
-
How do I know when a level has stopped working?
When price closes decisively through it multiple times without reacting, the zone has lost its memory. Remove it and mark the new level that price is respecting instead.
Short answers
- What timeframe is best for support and resistance on Quotex?
- Most traders start with the 4-hour chart to find major zones, then refine on the 15-minute or 5-minute…
- How many support and resistance levels should I draw?
- Keep it to three or four active zones per chart
- Can I use support and resistance for short-term Quotex trades?
- Yes
- Do support and resistance levels work during weekend OTC sessions?
- They still form, but reactions can be less clean because liquidity is thinner
- What is the biggest mistake beginners make with these levels?
- Entering before the reaction candle closes
- How do I know when a level has stopped working?
- When price closes decisively through it multiple times without reacting, the zone has lost its memory